In ctlab/gatom: Finding an Active Metabolic Module in Atom Transition Network

gatom
An R-package for finding active metabolic modules in atom transition network.
Full vignette can be found here.
Installation
library(devtools)
install_github("ctlab/gatom")
Quick start
library(gatom)
library(data.table)
library(igraph)
library(mwcsr)
First let's load data with atom mappings (network object),
enzyme annotations for mouse (org.Mm.eg.gatom)
and metabolite annotations (met.kegg.db.rda):
data("networkEx")
data("org.Mm.eg.gatom.annoEx")
data("met.kegg.dbEx")
Loading input data:
data("met.de.rawEx")
data("gene.de.rawEx")
Getting atom graph:
g <- makeMetabolicGraph(network=networkEx,
                        topology = "atoms",
                        org.gatom.anno=org.Mm.eg.gatom.annoEx,
                        gene.de=gene.de.rawEx,
                        met.db=met.kegg.dbEx,
                        met.de=met.de.rawEx)
print(g)
Scoring graph, obtaining an instance of SGMWCS (Signal Generalized Maximum Weight Subgraph)
problem instance:
gs <- scoreGraph(g, k.gene=25, k.met=25)
Initialize an SMGWCS solver (a heuristic relax-and-cut solver rnc_solver is used for simplicity, check out mwcsr package documentation for more options):
solver <- rnc_solver()
Finding a module:
res <- solve_mwcsp(solver, gs)
m <- res$graph
print(m)
head(E(m)$label)
head(V(m)$label)
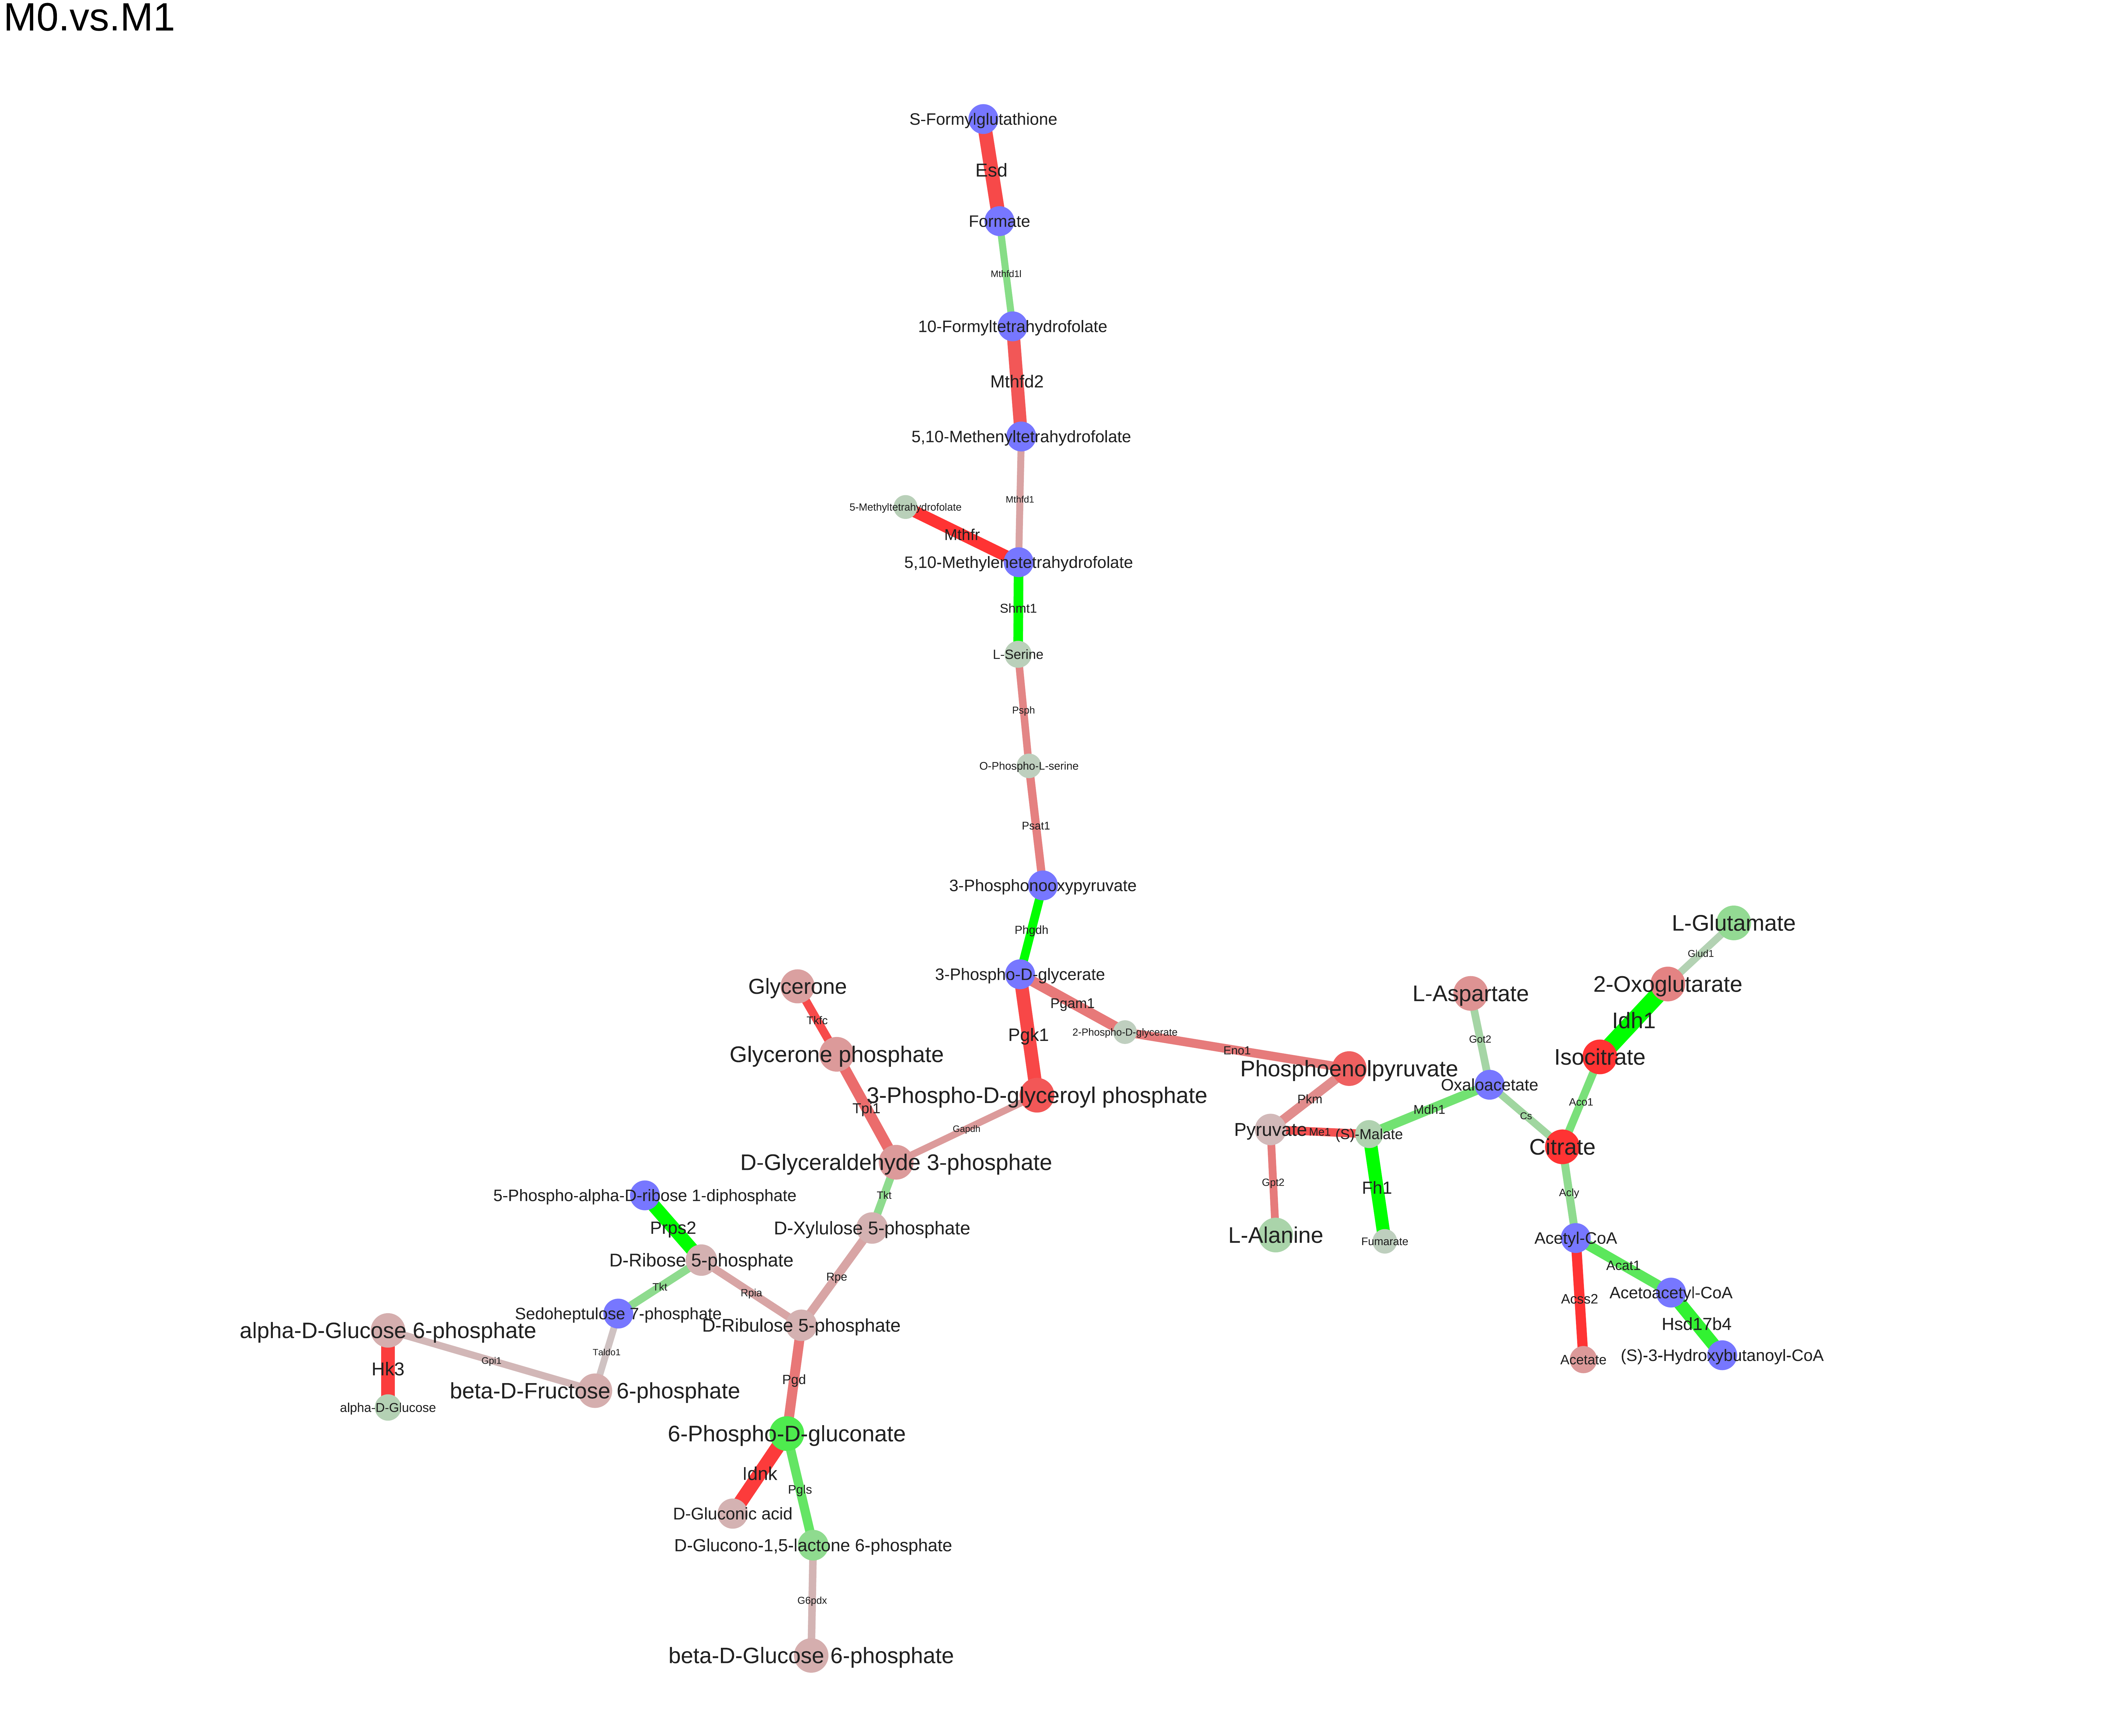
We can save the module to different formats (dot, xgmml, svg, pdf):
saveModuleToPdf(m, file="M0.vs.M1.pdf", name="M0.vs.M1", n_iter=100, force=1e-5)
ctlab/gatom documentation built on May 3, 2024, 3:44 p.m.
R Package Documentation
Browse R Packages
We want your feedback!
Note that we can't provide technical support on individual packages. You should contact the package authors for that.
![]()
gatom
An R-package for finding active metabolic modules in atom transition network.
Full vignette can be found here.
Installation
library(devtools) install_github("ctlab/gatom")
Quick start
library(gatom) library(data.table) library(igraph) library(mwcsr)
First let's load data with atom mappings (network object),
enzyme annotations for mouse (org.Mm.eg.gatom)
and metabolite annotations (met.kegg.db.rda):
data("networkEx") data("org.Mm.eg.gatom.annoEx") data("met.kegg.dbEx")
Loading input data:
data("met.de.rawEx") data("gene.de.rawEx")
Getting atom graph:
g <- makeMetabolicGraph(network=networkEx, topology = "atoms", org.gatom.anno=org.Mm.eg.gatom.annoEx, gene.de=gene.de.rawEx, met.db=met.kegg.dbEx, met.de=met.de.rawEx) print(g)
Scoring graph, obtaining an instance of SGMWCS (Signal Generalized Maximum Weight Subgraph) problem instance:
gs <- scoreGraph(g, k.gene=25, k.met=25)
Initialize an SMGWCS solver (a heuristic relax-and-cut solver rnc_solver is used for simplicity, check out mwcsr package documentation for more options):
solver <- rnc_solver()
Finding a module:
res <- solve_mwcsp(solver, gs) m <- res$graph
print(m) head(E(m)$label) head(V(m)$label)
We can save the module to different formats (dot, xgmml, svg, pdf):
saveModuleToPdf(m, file="M0.vs.M1.pdf", name="M0.vs.M1", n_iter=100, force=1e-5)
R Package Documentation
Browse R Packages
We want your feedback!
Note that we can't provide technical support on individual packages. You should contact the package authors for that.
Embedding an R snippet on your website
Add the following code to your website.
For more information on customizing the embed code, read Embedding Snippets.